COGOW etc for passage planning - and why you need them
by Lee Bruce on 18 Jul 2009
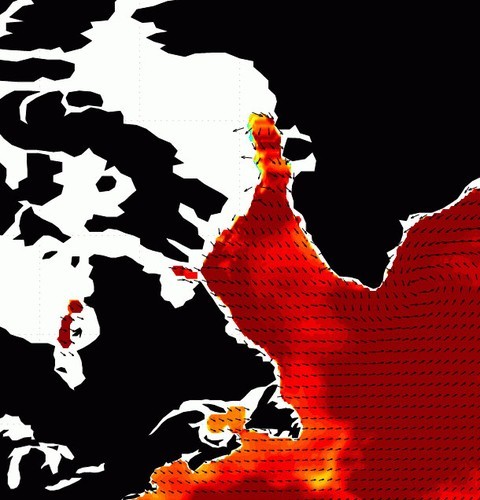
cogow SW
When passage planning, one needs all the help one can get to choose the right time to go, and the right winds to depart.
Next time you're planning a passage, try these websites for the help the can give you. Here Lee Bruce, of OceanMet (a division of Tactical Weather LLC) tells you why these sites can improve your planning:
Traditional climatology records are based on decades of data, and can be useful as long as we understand the limitations. Because the data are averaged over long periods, we can lose a feel for the variations that may occur. Extreme events are masked, so we don’t know how bad it could be in a worst-case scenario.
The problem is compounded over vast ocean areas because—until recently—there has not been a reliable data collection process. Ship reports are sparse and tend to be clustered near traditional trade routes. Extreme events may go under-reported because the crew is busy dealing with the problem at hand, and does not have the opportunity to report conditions.
But for several years now, a product has been available that uses sensors on a satellite to measure the wind over open ocean surfaces. The system (reading near real-time data collected by NASA/JPL's SeaWinds Scatterometer aboard the QuikSCAT satellite) scans the oceans twice each day, as the satellite revolves around the earth from pole to pole. Due to the footprint of the sensor, there is a shifting data gap with each pass that is widest near the equator. But overall, the information gathered is very good, and is a tremendous advantage over any previous data-gathering method.
Two of my favorite web sites that use QuickSCAT data can be used to review overall wind regimes for a passage. You can check wind observations on a daily/weekly/monthly basis for a particular year, or averaged over five years for a particular month. Each site has its benefits, and I recommend using both for passage planning.
Oregon State University has a site (above) that shows monthly averages over a five year period, and also presents a wind rose to show the wind distribution.
http://numbat.coas.oregonstate.edu/cogow/index.html
Remote Sensing Systems presents QuickSCAT data (below) as a monthly average for a specific year, a weekly average, or as raw daily data:
http://www.ssmi.com/qscat/scatterometer_data_monthly.html
If you need professional assistance planning a more than usually difficult route you can contact Lee at:
weather [at] oceanmet.com
If you want to link to this article then please use this URL: www.sailworldcruising.com/59165