
"Indisputable" new research proves effects of climate change are underway
by Daria Blackwell 26 Mar 2023 12:22 UTC
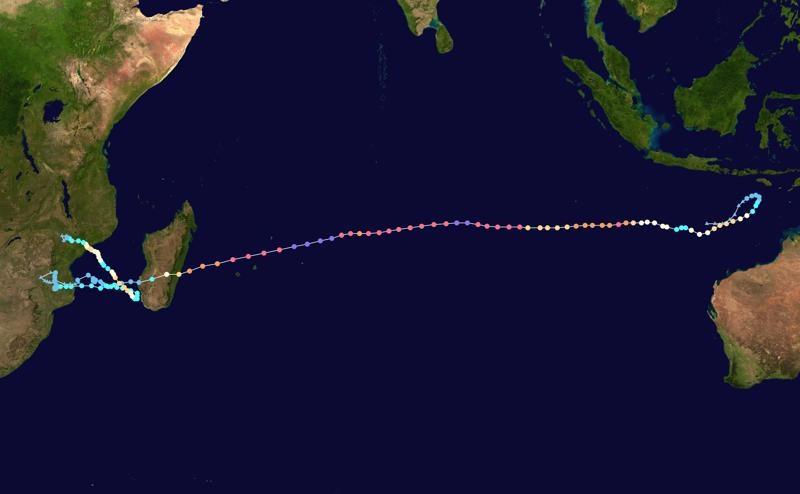
Track map of Severe Tropical Cyclone Freddy. The background image is from NASA. Tracking data is from NRL and NOAA © NASA
It has been a rough few weeks for climate change deniers. Multiple studies have confirmed that our climate is rapidly changing, and not for the better.
The Washington Post announced that a new study has provided indisputable evidence that a warmer world causes extreme drought and rain. Intense drought and heavy rainfall events occurred more often in the last eight years, the hottest years on record, than in the previous decade, according to the new study released in Nature Water this week. This is not a model or a theory. It is fact obtained from the observation of satellite data.
Another study published in the journal Nature also this week proved that Arctic ice has seen an 'irreversible' thinning since 2007. This new research suggests the decline was a fundamental change unlikely to be reversed this century. The authors suggest that this is proof that the planet has passed an alarming climactic tipping point.
Meanwhile, Tropical Storm Freddy has ripped through Southern Africa twice in one month. Overall, the cyclone killed at least 424 people: 326 in Malawi, 63 in Mozambique, 17 in Madagascar, 16 in a shipwreck near Mauritius, and 2 in Zimbabwe. Experts say climate change is making tropical storms around the world wetter, windier, and more intense.
Cyclone Freddy had broken records for the strength it accumulated over the 8,000-km (5,000-mile) path it travelled across the Indian Ocean from north-western Australia. It was one of the strongest cyclones ever recorded in the Southern Hemisphere and it is the longest-lasting storm of its kind in recorded human history. Freddy now holds the world record for "accumulated cyclone energy," a metric to gauge a cyclone's strength over time.
Data pertaining to the Track Map for Cyclone Freddy
Description: Track map of Severe Tropical Cyclone Freddy / Very Intense Tropical Cyclone Freddy of the 2022-23 Australian region cyclone season and the 2022-23 South-West Indian Ocean cyclone season. The points show the location of the storm at 6-hour intervals. The colour represents the storm's maximum sustained wind speeds as classified in the Saffir-Simpson scale (see below), and the shape of the data points represent the nature of the storm, according to the legend below.
Saffir-Simpson scale Tropical depression (=38 mph, =62 km/h) Tropical storm (39-73 mph, 63-118 km/h) Category 1 (74-95 mph, 119-153 km/h) Category 2 (96-110 mph, 154-177 km/h) Category 3 (111-129 mph, 178-208 km/h) Category 4 (130-156 mph, 209-251 km/h) Category 5 (=157 mph, =252 km/h)
Unknown Storm type ? Tropical cyclone ¦ Subtropical cyclone ? Extratropical cyclone / Remnant low / Tropical disturbance / Monsoon depression Date 2023-02-03-2023-03-14
This article has been provided by the courtesy of Ocean Cruising Club.